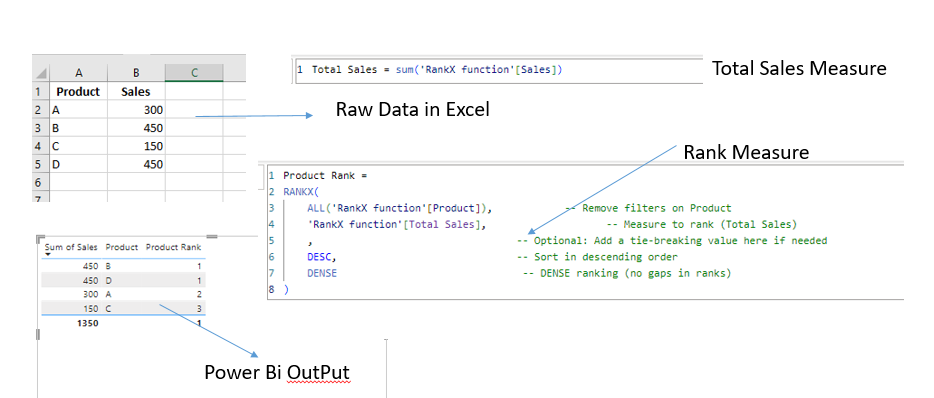
Power BI is a powerful tool that offers multiple ways to transform and visualize your data. One of its most helpful features is the RankX function, which allows you to rank items dynamically based on a measure, such as total sales or revenue. In this blog post, we’ll walk through a simple example of how to use the RankX function to rank products by total sales in Power BI.
Step 1: Create Two Measures
To begin using the RankX function, we first need to create two measures in Power BI. These measures will form the foundation of our ranking calculation.
Measure 1: Total Sales
The first measure we will create is called Total Sales, which calculates the sum of sales for each product.
Here’s the DAX formula for the Total Sales measure:
DAXCopy codeTotal Sales = SUM('Product Data'[Sales])
This formula adds up the sales values for each product, which we’ll later use to rank the products.
Measure 2: Product Rank
The second measure we will create is the Product Rank. This measure will use the RankX function to dynamically rank the products based on the total sales calculated in the first measure.
Here’s the DAX formula for the Product Rank measure:
DAXCopy codeProduct Rank =Product Data
RANKX(
ALL(''[Product]), -- Remove filters on ProductProduct Data
''[Total Sales], -- Measure to rank (Total Sales)
, -- Optional: Add a tie-breaking value here if needed
DESC, -- Sort in descending order
DENSE -- DENSE ranking (no gaps in ranks)
)
Let’s break down this formula:
- ALL(‘RankX function'[Product]): This removes any filters that might be applied to the products, ensuring that all products are considered in the ranking calculation, regardless of any slicers or filters in the report.
- ‘RankX function'[Total Sales]: This is the measure we want to rank the products by — in this case, total sales.
- , (optional tie-breaking value): You can add a tie-breaking value here if needed. This is useful when two products have the same sales amount, and you want to differentiate them based on another attribute. For example, you might use a secondary metric like Product ID to break ties.
- DESC: This ensures the ranking is in descending order, with the highest total sales getting a rank of 1.
- DENSE: The DENSE option ensures that ranks are consecutive, even when there are ties. For example, if two products tie for 1st place, both will be ranked 1, and the next product will be ranked 2 (without skipping rank 2).
Step 2: Visualize the Results
Now that we’ve created our two measures, you can add them to a Power BI report to see the ranking in action. Here’s how to do it:
- In your Power BI report, add a Table or Matrix visual.
- Drag the Product field into the rows of the visual.
- Add the Total Sales measure and the Product Rank measure to the values section of the visual.
The table will now display each product along with its total sales and its rank. You should see that the products are ranked in descending order of sales, with the highest-selling product ranked 1.
Conclusion
By using the RankX function in Power BI, you can create dynamic, rank-based insights into your data, helping you better understand performance across different categories like products, regions, or time periods. Whether you’re analyzing sales, profits, or any other metric, the RankX function is a powerful tool to make your reports more insightful and actionable.
For more tips on Power BI and DAX functions, stay tuned to our blog. Happy reporting!
